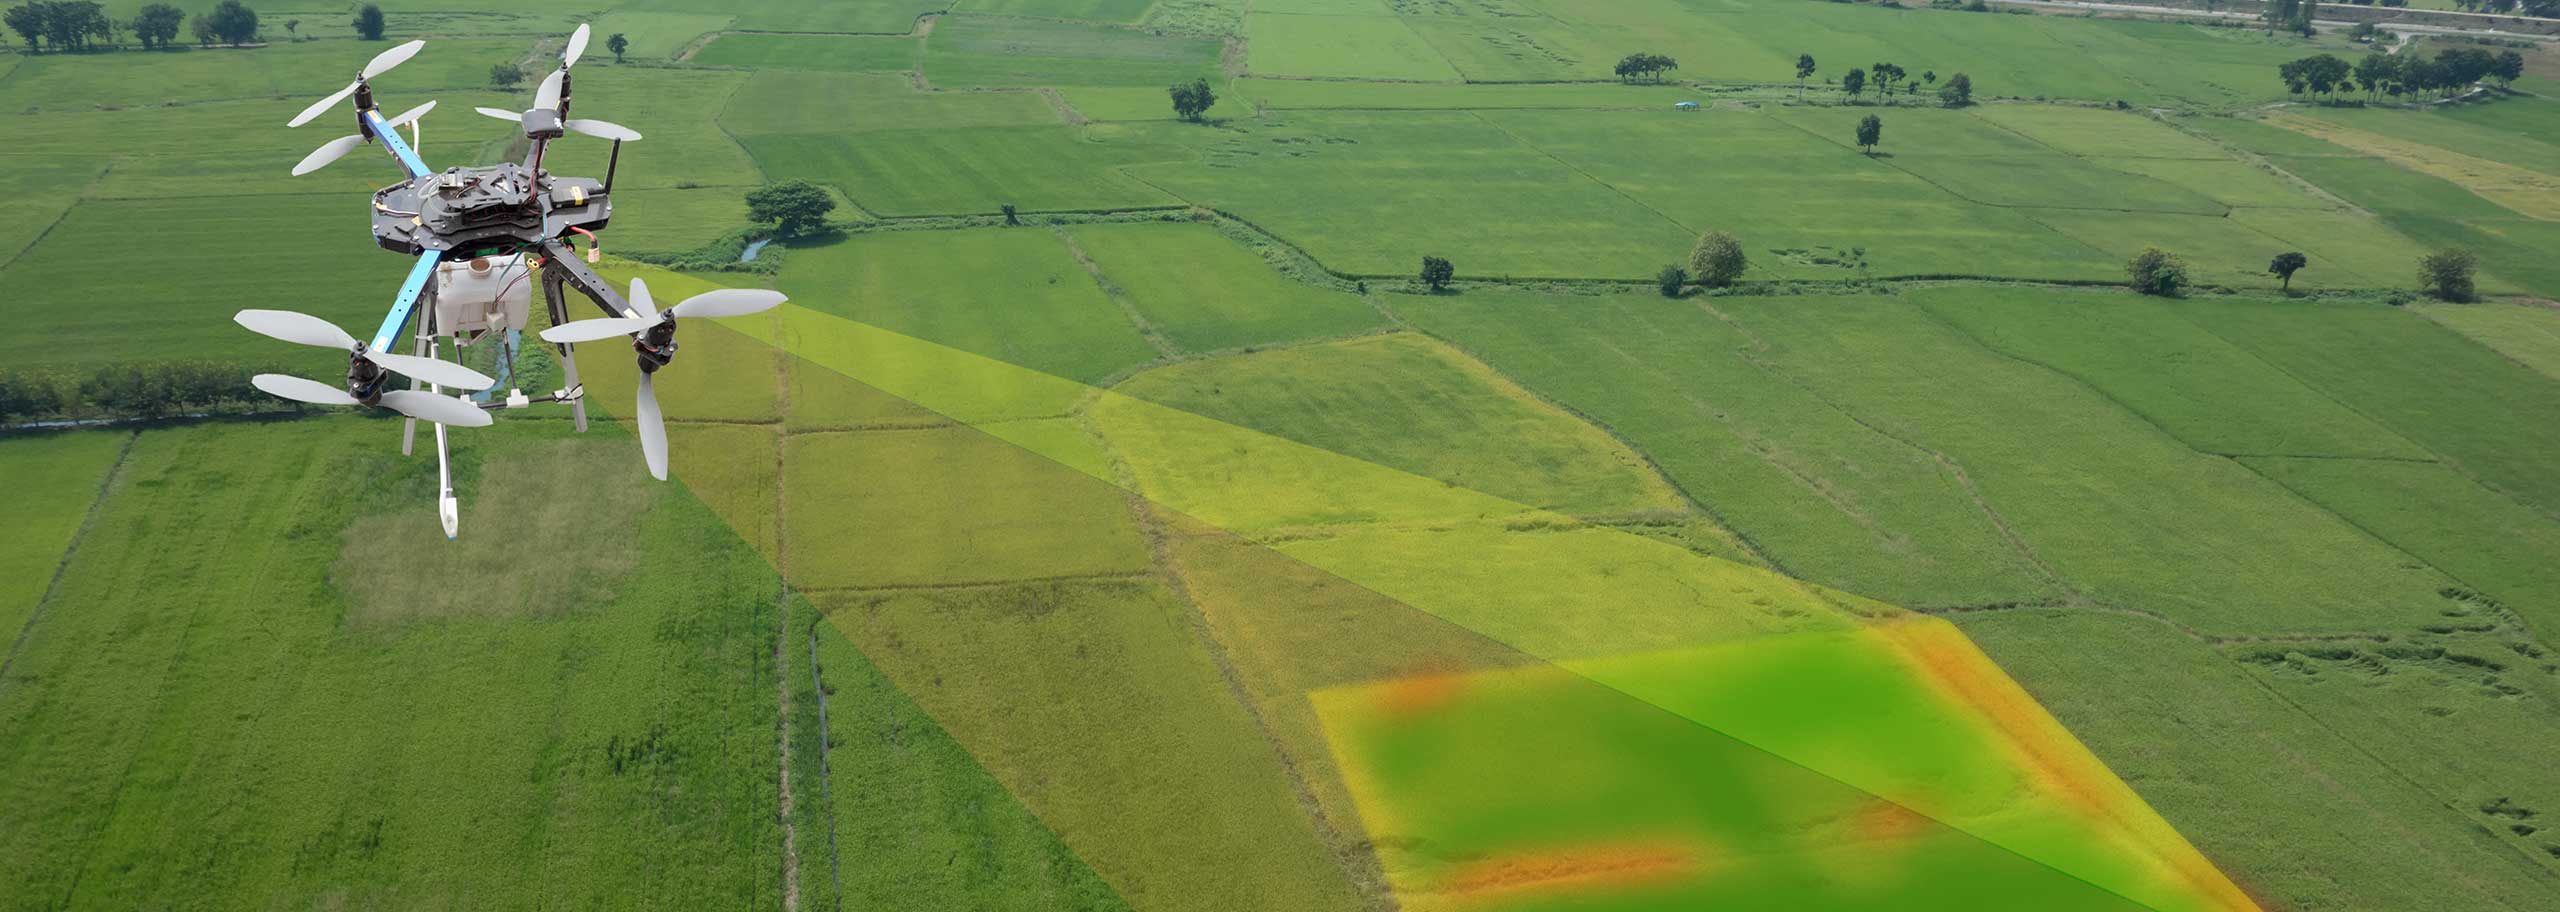
Remote monitoring of crop health is becoming a common practice in large and even smaller farms. Using publicly available satellite images or drones outfitted with specialized optical filters, farmers can monitor crops, and even individual plants, from afar. The correct combination of filters can help measure dehydration levels, chlorophyll levels, plant stress and weed infiltration. These methods gain contrast from spectral-dependent reflectance mapping.
Jump to:
- Considerations for drone-crop monitoring
- Example filters for crop monitoring
- Filter specifications for crop monitoring
- Optimizing spectral performance for crop monitoring
Considerations for drone-crop monitoring
1. Illumination- since the sun is typically used as the illumination source, the intensity can vary with cloud cover. Clouds, haze, and dust also influence the spectral distribution of the solar spectrum, preferentially scattering the lower wavelengths (Bartlett, et al., J. Geophys. Res. 103:31017, 1998). While the spectral variations are not a major contributor to errors, the system should be calibrated with a neutral (i.e. white) reflecting test target for the best measurements. This calibration step is common in satellite-based mapping applications.
2. Signal source-
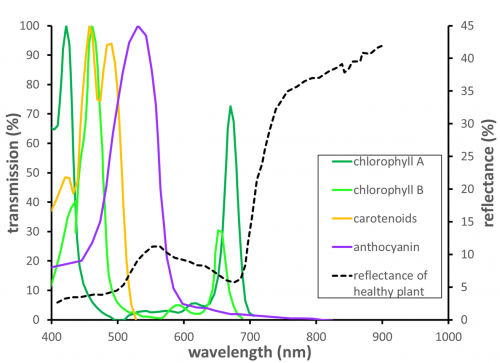
- Reflectance signal- a combination of hydration, chlorophyll content and other pigment content (anthocyanines and carotenoids) influence the spectral dependence of the reflectance. Sunlight is used as the illumination source. Carotenoids and anthocyanins are upregulated and chlorophylls are downregulated during stress, turning the crops yellow and brown. This shows up in the reflectance spectrum and vegetation indices described below.
- Thermography can be used to make a temperature-map of the crop in the 9-14 micron wavelength range. Plants with good hydration and transpiration are cooler than those that are dry and heat-stressed. Sunlight is not strictly necessary to do this measurement, but it can be done at the same time as reflectance because IR wavelengths are detected.
3. Drone flight height and lensing on the camera- determines the field-of-view and resolution of the images. The height and field-of-view also determine the angles-of-incidence that hit the filter you are using for imaging. Filter response typically shifts to lower wavelengths and the edges become less steep as the angle-of-incidence increases. Learn more about how angle-of-incidence affects filter performance.
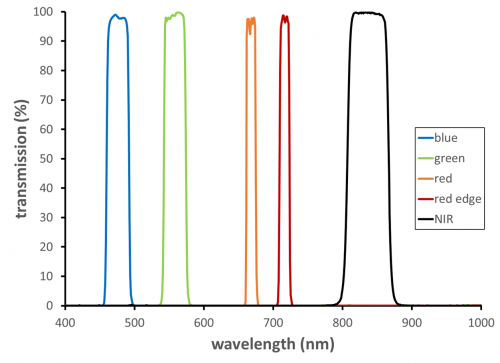
4. Spectral filters- typically bandpass filters that correspond to blue, green, red, red edge and NIR are used for normalized difference, red edge (NDRE) mapping. Some examples are below. Another option is to use linear variable bandpass filters which have a bandpass that changes wavelength over one dimension of the filter to provide a "rainbow" filter effect. This sort of filter produces a spectrum across the camera which enables hyperspectral imaging.
Example filters for crop monitoring
The following filter examples can be used to calculate the NDRE value for crops using 4 separate filter/camera combinations and computing the NDRE ratio. There are a number of vegetation indices in use that involve ratios and differences of specific wavelength bands (Xue and Su, J. Sens. 2017:1353691).
Filter Specifications for crop monitoring
- Bandpass center wavelength and full-width half-max (FWHM)
- f/# or angle-of-incidence distribution in your system
- Filter surroundings- In some systems, the filter is affixed with optical epoxy directly onto the detector chip. Most filters at Omega are designed to be used "in air", so we need to know if your filter will be "immersed" in epoxy before the design process begins!
Optimizing spectral performance for crop monitoring
Note that the optimal filter selection will depend on the spectral reflectance of the crop you are monitoring and the ratio of chlorophylls, carotenoids and anthocyanines present in the healthy (and sick) plants. Not only does each healthy plant type have its own ratio of these pigments, but the ratio can change when the plant is under stress. Carotenoids and anthocyanin are both upregulated during stress- this is why leaves turn yellow, red or brown when crops dry out or are under stress.